After a bit poking around, adding additional debugging to the web services and running it over and over again I was able to track down the source of this problem. It was when a particular XML fragment was being constructed out of JAXB objects, unfortunately this was one of the core fragments in the response so it had to be there.
Not willing to give up on this issue, I decided to see what I could be done to make it better. I had an idea of what I wanted to change, but needed some hard figures to be sure that it would be worthwhile. The idea was to remove JAXB and replace it with Velocity.
I needed a starting point and given the schema I was working with (HL7 v3) is quite complex, I decided to pick the AD data type, which represents an address. The XML for this can be generated without too much work. I opted for a simple 4 line address, which looked like this (the odd name spaces are due to JAXB in this case)...
Address XML Fragment
<addr xmlns:ns11="urn:hl7-org:v3" xmlns="org.hl7.v3" use="WP">
<ns11:streetAddressLine partType="SAL">1 Blogg Street</ns11:streetAddressLine>
<ns11:city partType="CTY">Joe City</ns11:city>
<ns11:state partType="STA">Blogg State</ns11:state>
<ns11:postalCode partType="ZIP">99999</ns11:postalCode>
</addr>
So that's what I had to work with, next I set up two Java classes, one to generate the XML fragment using JAXB, the other to generate the same fragment using Velocity. I made sure that the following was done too:
- Velocity template caching turned ON
- Velocity template reloading turned OFF (0 for the modification interval)
- Velocity Engine created once only
- JAXB Context for org.hl7.v3 is created once only
- JAXB ObjectFactory is static and created once
- Update: after some feedback I can confirm that schema validation was turned off for this test
- Both JAXB and Velocity generator classes return the XML fragment as a String
- Both generator classes set the same values for the generated XML each time during generation
Each test ran in Java 7 with a 4Gb static heap and the default GC settings.
I set up a Runner class that would instantiate the appropriate generator (JAXB or Velocity). This would iterate a number of times, generating the same XML fragment. For the purpose of this article I will show figures from iterating 100,000 times, however I did repeat this with various other iteration counts.
First lets see the number of loaded classes for each of the generators.
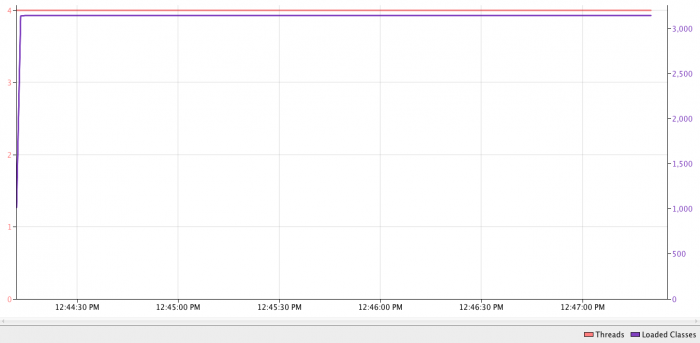
With JAXB, over 3000 loaded classes. Not unexpected since the schema is quite complex. This remains steady through the whole time.
Now with Velocity, the loaded classes also remain steady but are significantly reduced, down to around 1200. Straight away this implies that Velocity has a much lower memory requirement. Again not unexpected.
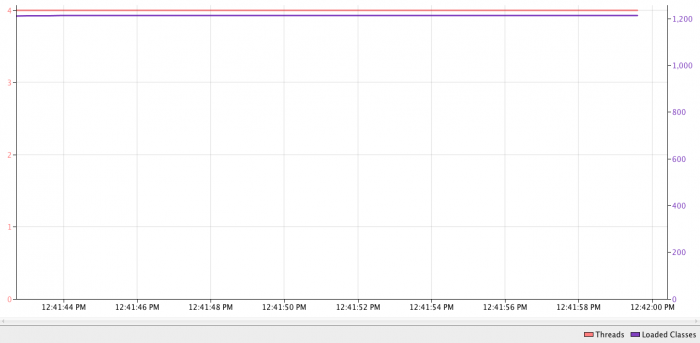
If you look closer at the time scales in the above graphs you can start to see the implications. JAXB took around 3 minutes to complete what took Velocity just under 15 seconds.
I've gathered some more data, running 100 iterations that each generated 100,000 XML fragments. These are the results...
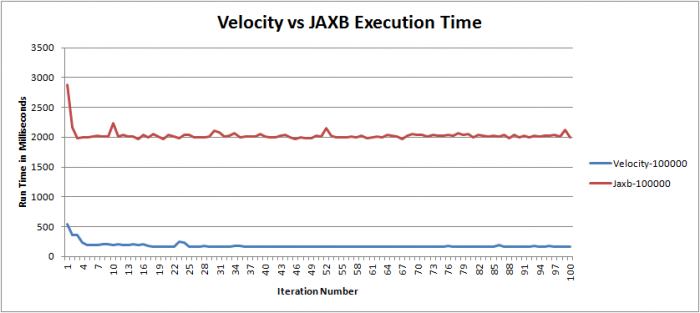
The initial times spike, but that's normal as everything gets loaded into memory and cached, so that can be ignored. The interesting thing is JAXB always took significantly longer to complete than Velocity. In fact this is an order of magnitude difference here.
So what does this mean? Velocity will always outperform JAXB in generating my XML fragment. That's great, but I really wanted to solve the memory issue, not improve the time it takes to produce my XML. However this is a great bonus.
So lets look at what the heap looked like.
With JAXB the heap usage peaked at around 1.3Gb. As is seen below this is thrashed quite a bit. Lots of object creation and garbage collection appears to be going on. This would be ok, except that this is happening very frequently.
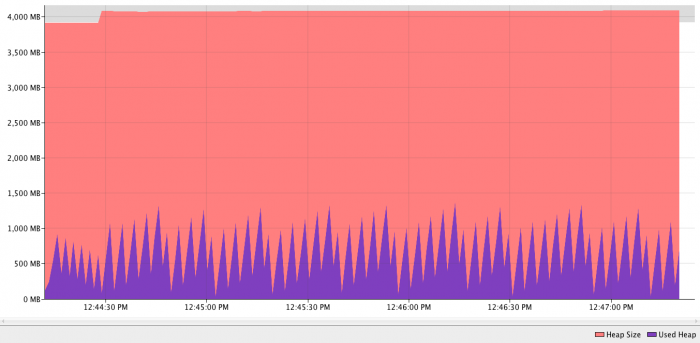
Compared to Velocity, the peak is around the same, 1.3Gb, however there are far fewer garbage collections.
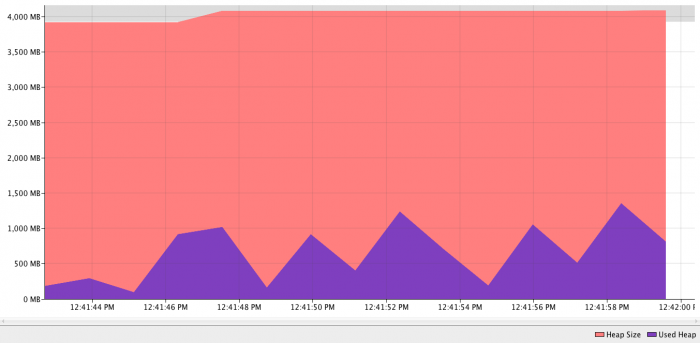
However the time scales are an issue, so zooming in on a 15 second period during the JAXB test, I get the following heap profile...
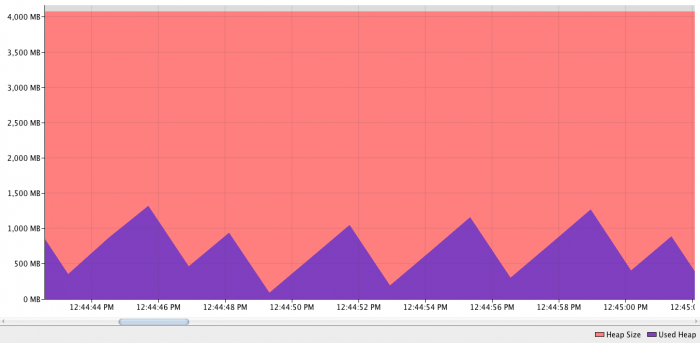
This looks remarkably similar to the heap profile for Velocity. However, we have to remember that in the space of 15 seconds, the Velocity generator was able to produce 100x 100,000 XML fragments. The JAXB generator only managed around 100x 555 XML fragments in the same time period.
These numbers can't be easily translated into performance gains for a bigger XML fragment, or even an entire XML document, however this approach seems promising.
♣ Open image gallery
to see this article's graphs.-i
