Since jemalloc does not write heap profile dumps at regular time intervals this was not a temporal analysis of memory allocation but could be treated as a sequential analysis of discrete heap profiles that happen to have occurred over a period of time. This could have been extended to take dump file creation time into account, however I did not do so. The analysis as is gave a good idea of patterns in memory allocation and in my case painted a very clear picture of where a memory leak was.
The input was a collection of heap profile dumps that have been post-processed as described in my previous article. The result of this post-processing was a collection of data files that had 3 columns each - procedure name, direct memory use and memory use of the procedure and its callees. A sample of one file looked like this...
Data File
os::malloc 55913480 55913480
updatewindow 13332416 13332416
init 6291456 6291456
CRYPTO_malloc 4292666 4292666
...
I used the direct memory use of a procedure and ignored the procedure+callee memory usage. This meant that I was only interested in the first and second columns in the file.
The challenge here was to stitch up all of the data files so that a 2D array was produced that contained each procedure's memory allocation from every data file. This was a somewhat sparse array because it was not guaranteed that all of the procedure names would appear in all data files. At first I tried to use the join command in Linux to do this but because of the sparseness of the data it didn't give me the correct results. I ended up writing some very simple code in Java that populated a HashMap with the data instead.
The procedure name was used as the map key and data was held in an long array the size of the number of input data files (1 file per column essentially). The code went along these lines (simplified here)...
Java
public static final void main(String[] args) throws IOException {
String dir = "/tmp/jeprof_data";
/* Read in all .dat files from the data directory and sort by name */
File path = new File(dir);
File[] files = path.listFiles(pathname -> pathname.getName().endsWith(".dat"));
Arrays.sort(files, Comparator.comparing(File::getName));
/* Determine number of columns, each data file produces one data column */
int numCols = files.length;
HashMap<String, long[]> data = new HashMap<>();
/* Process each data file adding its values in a new column */
int currentColumn = 0;
for (File f : files) {
List<String> lines = Files.readAllLines(
FileSystems.getDefault().getPath(f.getAbsolutePath()));
for (String line : lines) {
String[] values = line.split("\\ ");
String funcName = values[0];
if (!data.containsKey(funcName)) {
data.put(funcName, new long[numCols]);
}
data.get(funcName)[currentColumn] = Long.parseLong(values[1]);
}
currentColumn++;
}
/* Print out each row of data that had more allocated memory at the end of */
/* the run vs the beginning using a space-delimited format */
int bytesCutOff = 0;
for (String key : data.keySet()) {
long[] vals = data.get(key);
if (vals[numCols - 1] - vals[0] > bytesCutOff) {
System.out.println(
key + " " + Arrays.toString(vals).replaceAll("\\[|\\]|,", "")
);
}
}
}
That code produced output like the one below. Each of the procedure names had its memory allocation on one line with each profile data file sample separated by a space character i.e. 20 dump files would produce a final file that had 21 columns (1 column for the procedure name and 20 samples).
Something to note was that the final output contained only those procedures that had more memory allocated at the end of the sample period vs the beginning. This served to remove noise and reduce the size of the potential memory leaking procedures. The bytesCutOff was set to zero in my case but it was possible to use it to also filter out any 'small leakers', leaving just the more significant memory hogs.
Final Output
createVariantObject 656320 5250563 15751691 16014219 ...
ObjectSynchronizer::omAlloc 287487 718718 1293693 1293693 ...
vordel_xmlParseEncName 0 0 262160 262160 ...
__gnu_cxx::new_allocator::allocate 131096 131096 131096 131096 ...
Vordel::AppendDB::getOrCreateFile 0 0 131328 131328 ...
CRYPTO_malloc 4292666 5232841 6892452 7419465 ...
VariantObject 918176 3148032 8788257 8919425 ...
...
The above data set was then plotted in Excel and produced a graph similar to this...
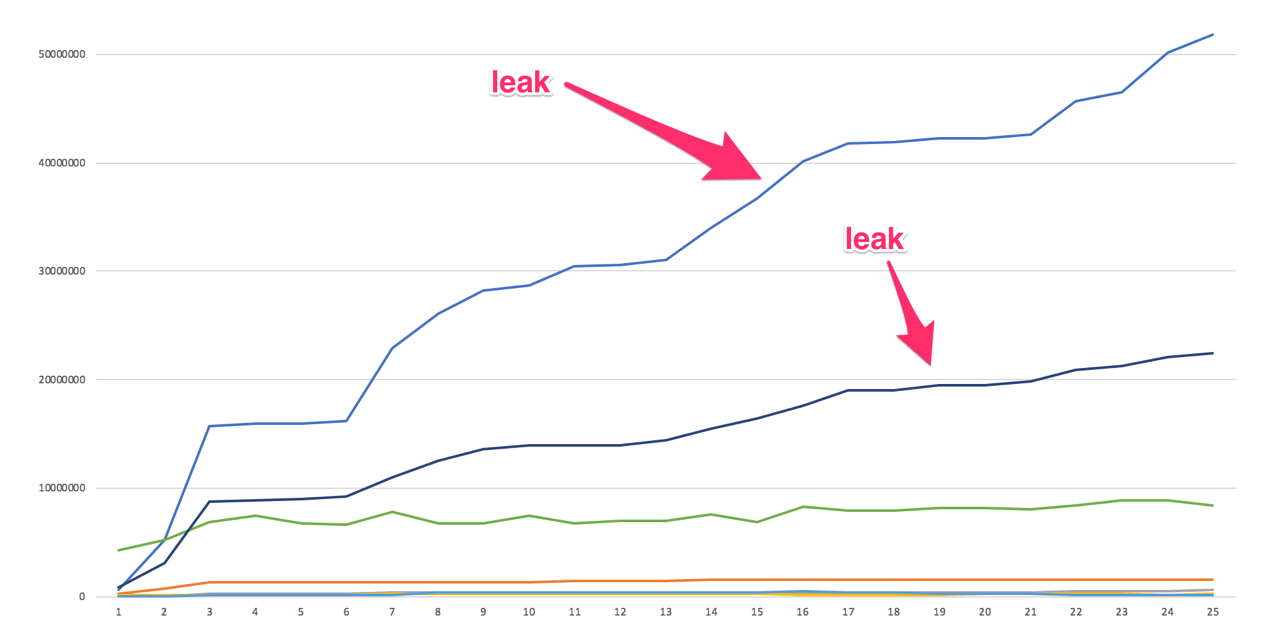
From that graph it was very clear which procedures were the majority leakers. By plotting data over multiple profile dumps made it very easy to see patterns in memory allocation that were not possible to see by looking at individual heap profiles.
That was not the end of the analysis however. The plotting only went as far as identifying the procedures to concentrate on. After this I looked at the final heap profile and generated a call graph using jeprof. From the call graph I could see that both of my majority leakers were related and they originated somewhere in the Java code.
Decompiling Java code and tracking down where these procedures were called was next. That work is outside the scope of this article however. Happy leak hunting!
-i
