Recently I had a need to check on the usage of the WebLogic thread pool and given some of the constraints I've been working with, the easiest way to do that was to go look into the WebLogic managed server logs. These were found in $DOMAIN_HOME/servers/<managed_server>/logs.
The managed server log has INFO level log entries like this...
Managed Server Log
####<Jun 27, 2019 9:16:22,429 PM AEST> <Info> <WorkManager> <host.domain> <managed_server> <Timer-2> <<WLS Kernel>> <> <uuid> <1561634182429> <[severity-value: 64] [rid: 0] [partition-id: 0] [partition-name: DOMAIN] > <BEA-002959> <Self-tuning thread pool contains 1 running threads, 3 idle threads, and 20 standby threads>
With a few commands this can be filtered down to something more usable like a CSV file...
Command
ls -rt *.log* | xargs grep "Self-tuning thread pool contains" | awk -F"<" '{print $2 $15}' | awk '{print $18 "," $14 "," $11}' > thread_history.csv
This gives us output that looks like the sample below (note the output of thread pool statistics are in reverse order vs what is written into the log file). The CSV file columns are thread counts for "standby, running, idle".
CSV File
...
14,0,2
4,11,1
9,6,1
4,11,1
...
I found the best plot for this was an area plot, which nicely superimposes active and idle threads on the standby threads due to the order of columns in the CSV file (that's why the order of these was reversed above). The result looked something like this...
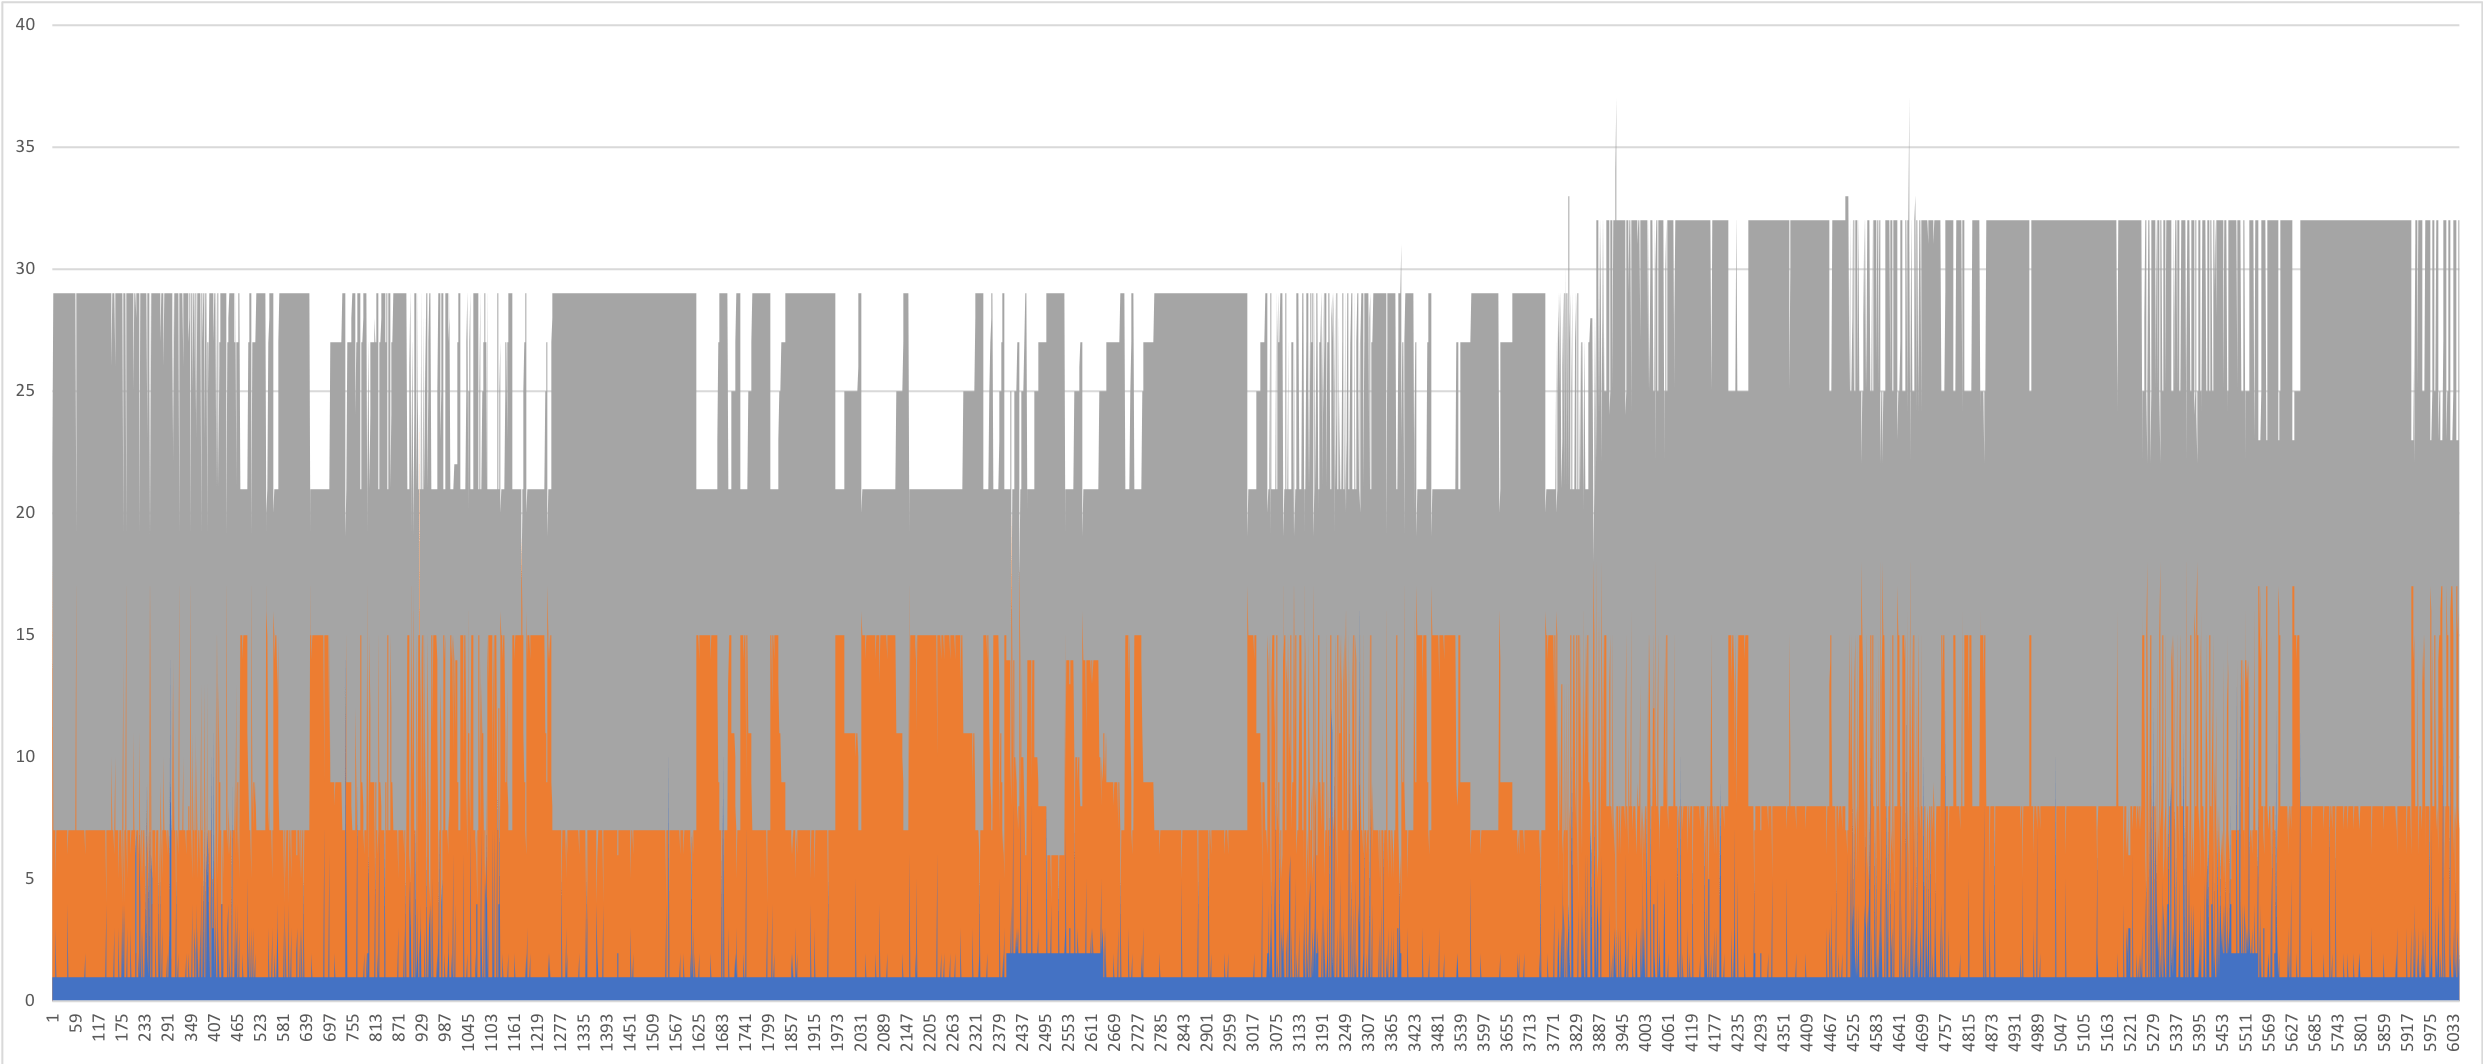
Here the running threads are shown in orange, idle threads in blue and standby threads in grey.
You can get a bit more fancy with this and also extract the date/time components from the log file but given these statistics are logged every 2 minutes, it's hardly necessary.
Using this approach was a quick way to see if my WebLogic server was coming close to it's maximum thread pool capacity. If you find this useful, do share your plots, I'd love to see how other servers are running!
-i
