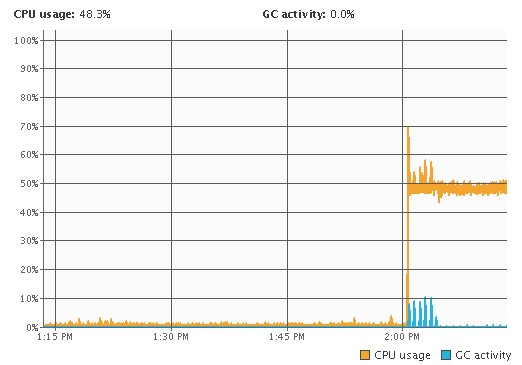
In JVisualVM that looked something like this...

Since JVisualVM takes the number of cores into account, the JVM was hovering around the 50% of the overall CPU time for the machine. Using the top command gave a different picture of the same issue. In top, the java process was being reported to use around the 100% of CPU time (which it was on that core)...
The PID of the process was what I needed to get out of top and in this case it was 29329.
top
$ top
PID USER PR NI VIRT RES SHR S %CPU %MEM TIME+ COMMAND
29329 oracle 20 0 10.3g 5.5g 34m S 98.4 70.3 6:14.49 java
...
Just having the PID for the JVM was not enough though. Pressing the shift-h key combination in top switched to thread display mode which revealed more about what was consuming all of that CPU. In my case I had 3 threads taking up considerable amount of CPU time...
top
shift-h
PID USER PR NI VIRT RES SHR S %CPU %MEM TIME+ COMMAND
29523 oracle 20 0 10.3g 5.7g 34m S 56.6 72.6 0:01.71 java
29430 oracle 20 0 10.3g 5.7g 34m R 49.3 72.6 2:02.40 java
29356 oracle 20 0 10.3g 5.7g 34m R 49.0 72.6 2:16.29 java
...
Even though there were 3 threads, looking closely at these results showed that the thread with the PID of 29523 had only used 1.71s of CPU time so was not likely the culprit. The other two were both on over 2mins of CPU time (the server was not up for that long) so were likely the culprits here.
Now I had enough information about the JVM and the threads it was time to use jstack to get a thread dump. This required the JVM PID to be passed in and I sent the output to a temporary file like so...
jstack
$ jstack 29329 > /tmp/jstack.txt
Now it was time to do some decimal to hexadecimal conversion. Since the stack trace lists thread IDs in hex and top reported them in decimal, I used this site to convert the two thread PIDs I was interested into hex. In my case the results were like this...
Decimal to Hex
29430 -> 0x72f6
29356 -> 0x72ac
Now it was a matter of looking through the thread dump file and finding the threads using their IDs (by looking for nid=<PID> in the dump). I got two stack traces from that...
jstack.txt - 0x72f6
"[ACTIVE] ExecuteThread: '16' for queue: 'weblogic.kernel.Default (self-tuning)'" daemon prio=10 tid=0x00007fd420017000 nid=0x72f6 in Object.wait() [0x00007fd411b9b000]
java.lang.Thread.State: WAITING (on object monitor)
at java.lang.Object.wait(Native Method)
at java.lang.Object.wait(Object.java:503)
at weblogic.common.CompletionRequest.getResult(CompletionRequest.java:109)
- locked <0x00000006c646e170> (a weblogic.common.CompletionRequest)
at weblogic.diagnostics.archive.wlstore.PersistentStoreDataArchive.readRecord(PersistentStoreDataArchive.java:695)
- locked <0x000000060c948708> (a weblogic.diagnostics.archive.wlstore.HarvestedPersistentStoreDataArchive)
at weblogic.diagnostics.archive.wlstore.PersistentStoreDataArchive.readRecord(PersistentStoreDataArchive.java:668)
at weblogic.diagnostics.archive.wlstore.PersistentStoreDataArchive.deleteDataRecords(PersistentStoreDataArchive.java:1285)
- locked <0x000000060c948708> (a weblogic.diagnostics.archive.wlstore.HarvestedPersistentStoreDataArchive)
at weblogic.diagnostics.archive.wlstore.PersistentStoreDataArchive.retireOldestRecords(PersistentStoreDataArchive.java:1211)
at weblogic.diagnostics.archive.DataRetirementByQuotaTaskImpl.performDataRetirement(DataRetirementByQuotaTaskImpl.java:92)
at weblogic.diagnostics.archive.DataRetirementByQuotaTaskImpl.run(DataRetirementByQuotaTaskImpl.java:49)
at weblogic.diagnostics.archive.DataRetirementTaskImpl.run(DataRetirementTaskImpl.java:261)
at weblogic.work.SelfTuningWorkManagerImpl$WorkAdapterImpl.run(SelfTuningWorkManagerImpl.java:553)
at weblogic.work.ExecuteThread.execute(ExecuteThread.java:312)
at weblogic.work.ExecuteThread.run(ExecuteThread.java:264)
jstack.txt - 0x72ac
"Thread-7" prio=10 tid=0x00007fd414068000 nid=0x72ac runnable [0x00007fd454325000]
java.lang.Thread.State: RUNNABLE
at weblogic.store.io.file.direct.DirectIONative.unmapFile(Native Method)
at weblogic.store.io.file.direct.FileMapping.unmapView(FileMapping.java:192)
at weblogic.store.io.file.direct.FileMapping.mapView(FileMapping.java:162)
at weblogic.store.io.file.direct.FileMapping.remapViewInit(FileMapping.java:140)
at weblogic.store.io.file.direct.FileMapping.getMappedBuffer(FileMapping.java:210)
at weblogic.store.io.file.StoreFile.mappedRead(StoreFile.java:508)
at weblogic.store.io.file.Heap.read(Heap.java:989)
at weblogic.store.io.file.FileStoreIO.readInternal(FileStoreIO.java:305)
at weblogic.store.io.file.FileStoreIO.read(FileStoreIO.java:281)
at weblogic.store.internal.ReadRequest.run(ReadRequest.java:34)
at weblogic.store.internal.StoreRequest.doTheIO(StoreRequest.java:89)
at weblogic.store.internal.PersistentStoreImpl.synchronousFlush(PersistentStoreImpl.java:1086)
at weblogic.store.internal.PersistentStoreImpl.run(PersistentStoreImpl.java:1070)
at java.lang.Thread.run(Thread.java:745)
From here I could go on with my debugging, but from both the stack traces it was clear to me that something was wrong with the persistent file store. A little bit of the mystery was solved!
-i
