As I mentioned in the previous article where I described how I fixed high CPU usage in WebLogic, these spikes occurred on the hour. Specifically they were about 2.5 minutes past the hour. It didn't matter when the server was started/restarted, like clockwork at 2.5 minutes past every hour I would see a CPU spike...

From earlier debugging I knew that the high CPU usage was to do with a corrupted file store. This gave me a bit of a clue of where to look next. I looked over at this WebLogic documentation: Configure diagnostic archives. Here it had this interesting setting -
In the Store Size Check Period field, enter the interval, in minutes, between the times when the store will be checked to see if it has exceeded the preferred store size.
Ok the documentation appeared to be incorrectly stating this was in minutes, it was in fact in hours (later versions of the documentation corrected this). However, that was a periodic check but it did not indicate that it was a check that was scheduled on the hour. The documentation implied that the check simply happened after the specified period of time elapsed.
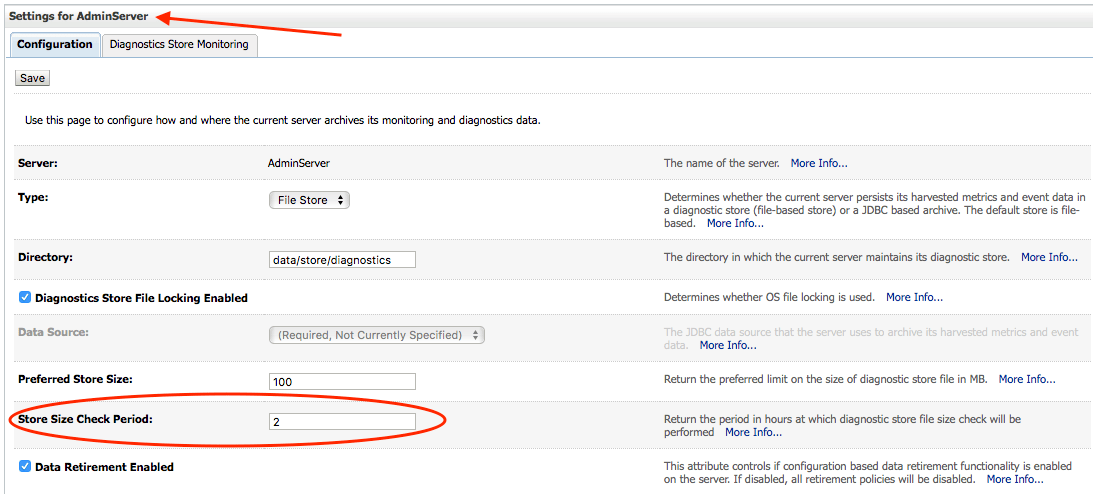
The default setting for Store Size Check Period was 1 hour. I decided to bump it up to 2 hours to see what change it would make. This was done on the Managed Server diagnostic archives configuration.
Managed Server restarted, on the next hour, CPU spike again. Obviously that setting had no effect. I then decided to see what the AdminServer had configured. It was the default 1 hour value, so I changed that to two and restarted both the Admin and Managed Servers.
Success! On the first hour...no CPU spike! On the second hour, the CPU spike appeared in line with the new setting. It was interesting that only the AdminServer setting would be responsible for the change in behaviour even though the CPU spike was occurring on the JVM for the Managed Server. However I am not ruling out the possibility that because I didn't restart the AdminServer on my first setting change that these changes didn't actually come into effect.
That was a mystery solved, and it showed an interesting timing behaviour with WebLogic internal scheduling.
-i
